Measure of the Emotional Reaction to Christmas Adverts from Toys R Us, The Body Shop, IKEA and Coca Coca
At imarklab and Leger, research is our core business. As passionate researchers, we like to continually investigate our own research methods. We have recently been interested in emotions measurement through the FaceReader software. This technology is used in academic research by the Tech3Lab of HEC Montreal. In our case, we use this tool to track users’ emotional reactions when browsing a Web or mobile interface. We used it in a political context this fall to analyze the facial expressions of the federal parties’ leaders. This time, we studied emotional reaction to advertisement.
We recruited eleven Leger’s employees and asked them to individually watch four Christmas video ads: “Like Father, Like Daughter” from Toys R Us, “Jingle Bells” from The Body Shop, “Soft Toys 2015” from IKEA, and “Share the Good” from Coca Cola. You probably see us coming – we recorded and analyzed their facial expressions during each ad. We also discussed with them afterwards to know which they preferred.
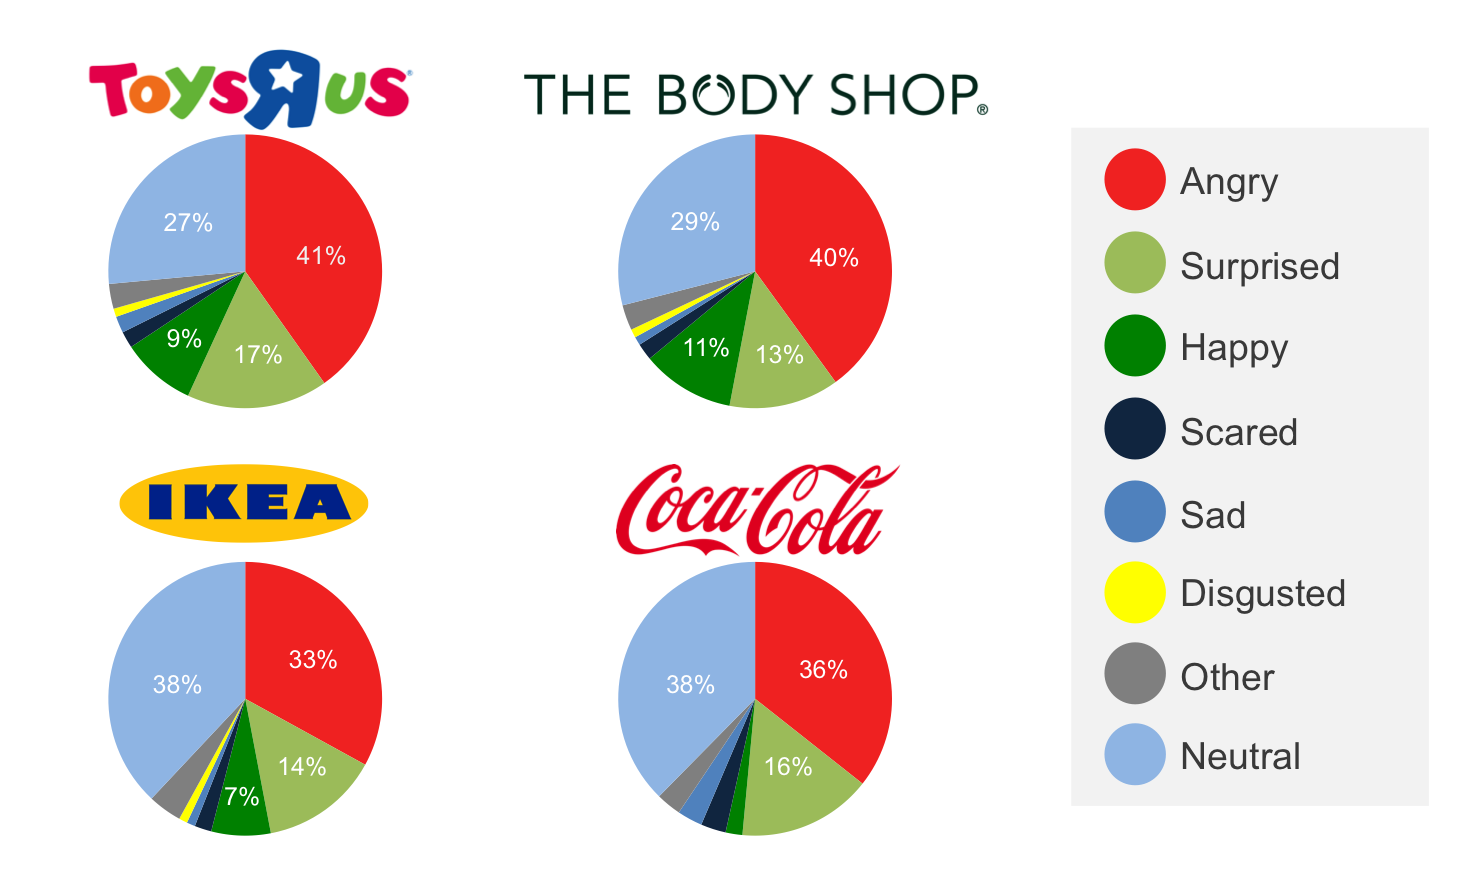
Emotional Summary for Each Ad
The most liked ads were the ones who caused the strongest emotional reactions and therefore, the least neutrality. Participants thought that the Toys R Us’ ad was the best, followed by The Body Shop’s ad. They were not as enthusiastic about IKEA’s and Coca Cola’s ads. In addition to causing the least neutrality, Toys R Us’ advert surprised the most (17%). Considering the data below, The Body Shop’s advert ranks second with 29% of neutrality but gets first place for happiness (11%). These results are consistent with what participants told us when we discussed their impressions.
 Why Are People so Angry?
This is exactly the question I asked myself when I first saw the results – and then I recalled that we are naturally averse to advertisement. We es not choose to have it in our life. The results of a survey conducted in China and reported by eMarketer (2015) showed that 87% of people have a primarily negative attitude toward video ads. 55% of US social media users also reported that ads on social platforms leave them indifferent or disrupt their experience (eMarketer, 2015). These studies show that people naturally tend to get angry when video ads are imposed, regardless of the media (Internet, television, etc.).
The emotional summary is interesting but is not the most relevant data in an advertisement setting. FaceReader also measures emotional valence, which enables us to link specific segments of an ad with a variation of the positive or negative intensity. Let’s make it simple: with emotional valence, we know precisely what is causing a reaction and when it occurs. Here is how it looks like in our case:
1. Toys R Us : “Like Father, Like Daughter”
In addition to being the best according to our participants, Toys R Us’ ad is the only one that left them on a globally positive emotional state (valence line above the horizontal axis). The omnipresence of anger in their faces kept their emotional reaction globally negative or near neutrality (horizontal axis) during the other ads.
The emotional journey experienced by participants reflects three distinct parts of the story told by Toys R Us. First, there is a positive start when the little girl’s mother comes to “rescue” her father who does not seem to know how to entertain her. Second, the story gets darker. The father cannot develop a good relationship with his daughter who does not share his interest for Star Wars. At the end, there is a positive rise of the emotional state. The little girl is finally “like her father” handling a laser sword with passion in her eyes – a funny and surprising end that left participants on a positive note!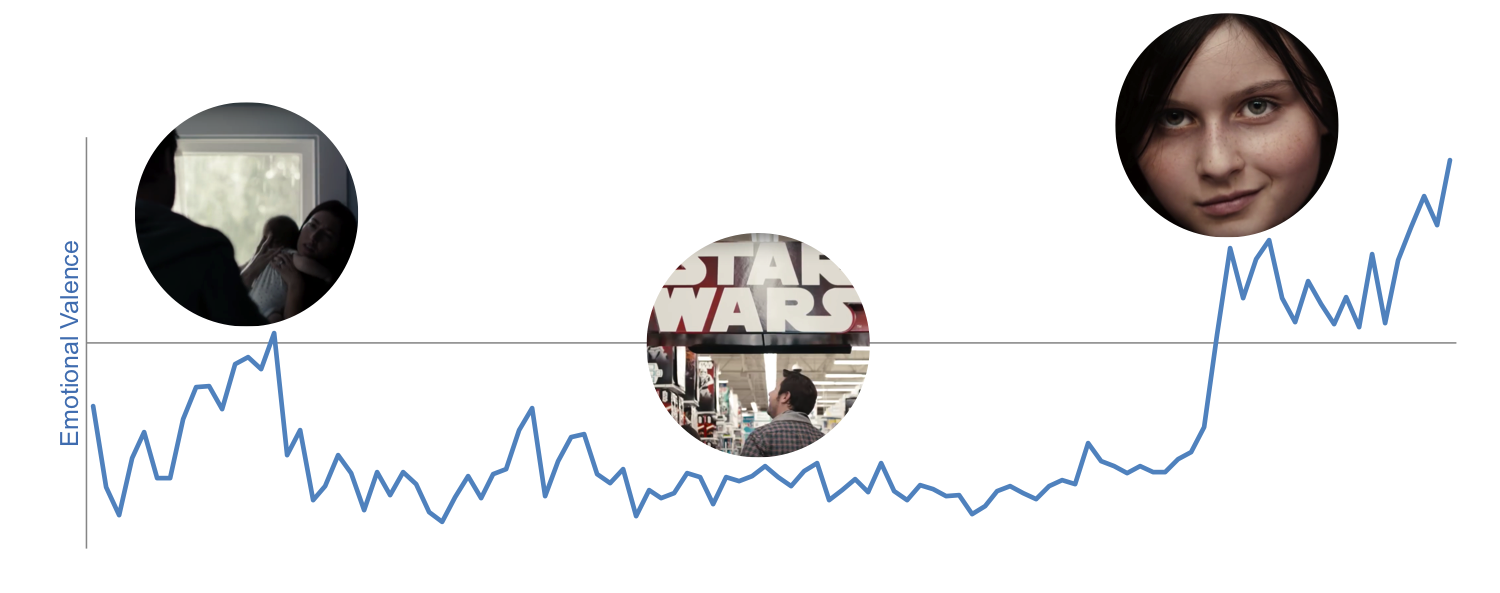
2. The Body Shop : “Jingle Bells”
The Body Shop’s ad is the second best according to our participants. Emotional reaction was not as positive as with Toys R Us’ but it brought a fair amount of emotional peaks. Amusing fact: three of the four peaks happened when the same actor was showering. He seems to have a je ne sais quoi that people loved! The last peak happened at the end of the singing part of the advert, just as there is a zoom on red underwear…
We noticed that the emotional state becomes more negative at the end of the ad, when the emphasis is put on the advertised product. This is not surprising considering the message is more promotional than entertaining at this point. Participants were still left on a positive note and had a good impression of this video ad.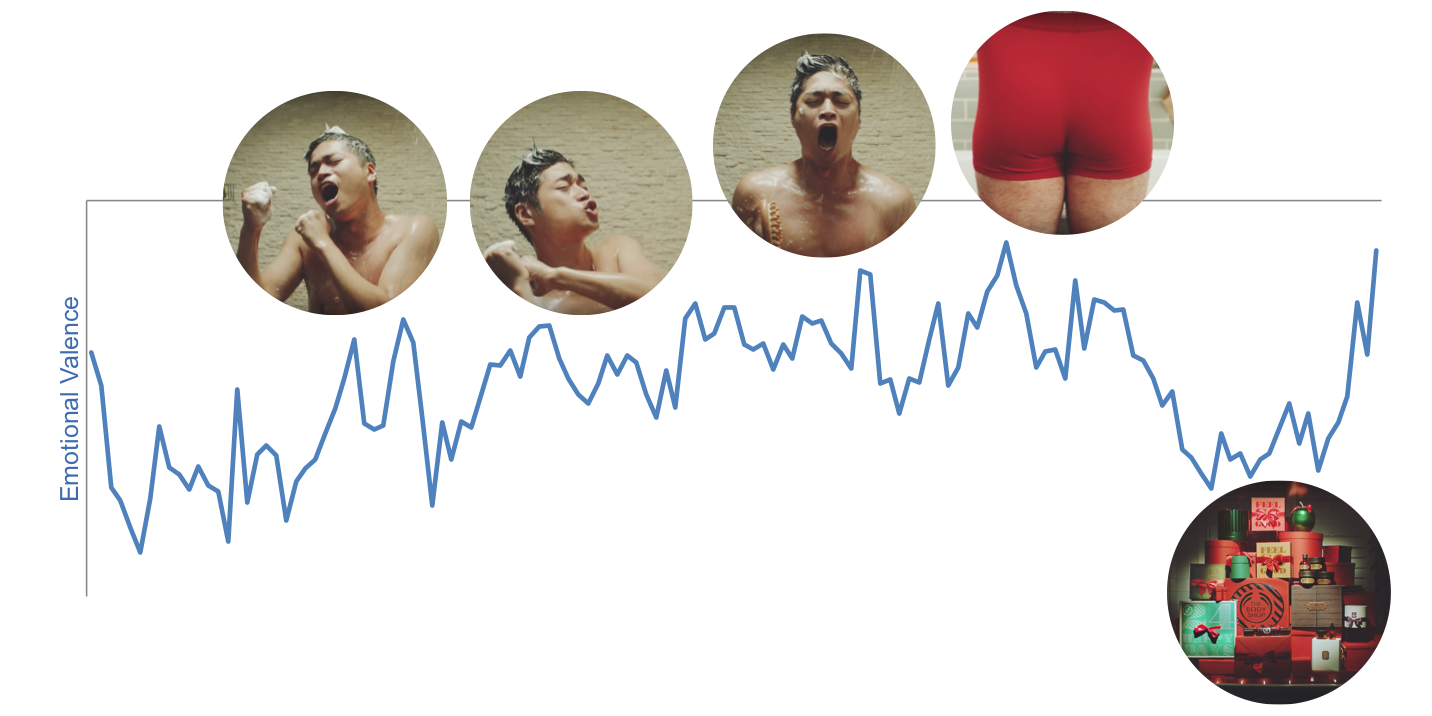
3. IKEA : “Soft Toys 2015”
Some participants thought that IKEA’s advert was too long, and somewhat cheesy in how it presents children. However, the adorable children still had an impact on their emotional state. The four most positive emotional peaks occurred when children were directly involved in the story: when we see the children’s drawings all together, when these drawings are transformed into real soft toys, and when two children receive the soft toy they drew as a gift (and are very happy obviously).
At the end of the ad, the emotional state became more negative and did not go back up. The length of the video can explain this drop. At this point, some people might have felt overwhelmed (angry, disgusted, etc.) by the happy children cliché.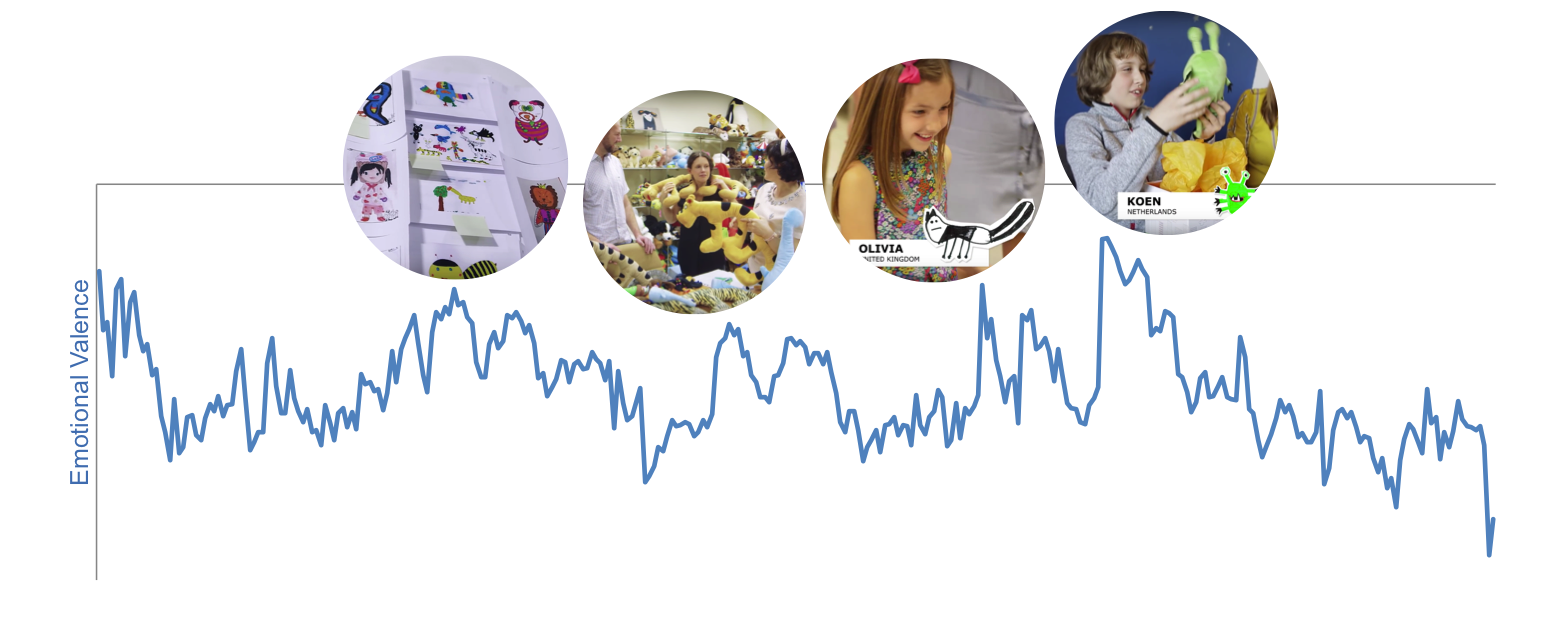
4. Coca Cola : “Share the Good”
All the participants agreed: Coca Cola’s advert is less interesting. The emotional journey is very negative in comparison to the other ads, and stays this way during most of the ad. The valence line is far below the horizontal axis. Nonetheless, the emotional state quickly became more positive at the end when the brand’s logo is presented with the classic jingle, bringing participants back to neutrality.
Coca Cola’s logo and music recall something familiar and warm that makes the ad end on a positive note. Even if participants found it less interesting, they did not say it was a bad ad. According to them, it was simply “what we expect from Coca Cola”.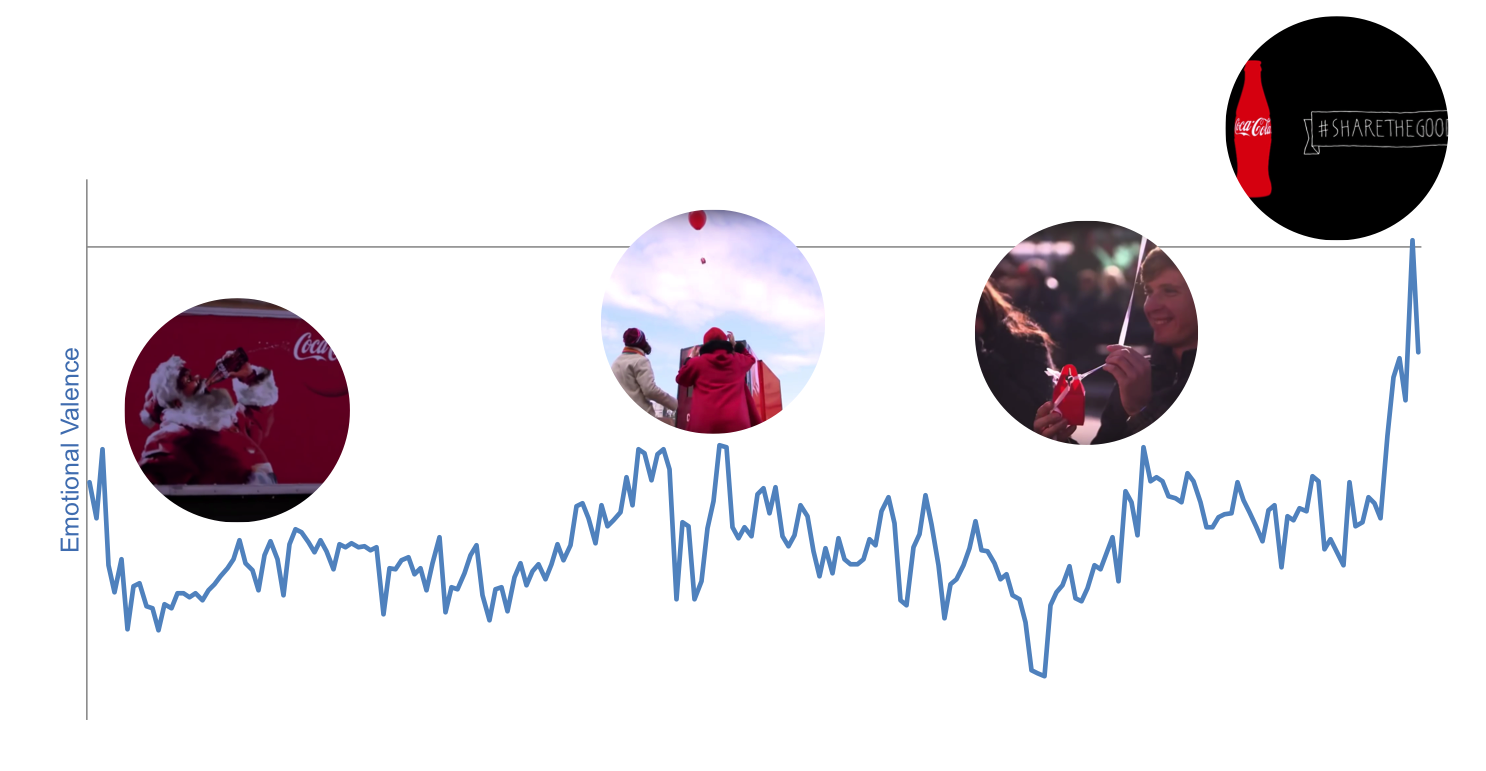
Face Reading and Advertising Effectiveness
It is true that we compared very different ads in terms of form and products. Do not worry – our goal was not to compare toys, shower gels, bookcases and soft drinks. We wanted to test emotions measurement in advertisement – do research on research. The conclusions are very interesting. We could directly link the emotional valence with the “story” told by each ad. We also deepened our understanding of what participants told us, and confirmed findings from previous studies about online video ads.
Our participants preferred the funny ads. We can presume they would be more likely to tolerate them in a real setting (e.g.: browsing the Web at home). No surprise here. The main reason why smartphone users will pay more attention to digital video ads (and not skip them) is if “it is funny or humorous” (eMarketer, 2015). Also, videos that evoke an intense emotional reaction are more likely to be shared and become viral – the more intense the reaction is, the better the video will perform (Harvard Business Review, 2015). This is exactly what we noticed in our analysis of the emotional summary: participants preferred the ads to which they reacted the most intensely. More precisely, Toys R Us’ ad is their favorite and also the most surprising. This is consistent with a study published in the MIT Sloan Management Review (2015) – emotionally surprising videos are the most likely to be liked and shared around the Web.
Does Emotions Measurement Have Value for Advertisers?
Yes, they definitely do have value for advertisers. Emotions measurement enables us to deepen our understanding of qualitative data provided by individual interviews or focus groups. It is an interesting tool to link consumers’ opinions to specific segments of a video ad. We tested four distinct ads in this project. That being said, emotions measurement would be especially useful to compare similar video ads, promoting the same product or that are simply different versions of a single ad.
***
Methodological Approach
Participants were all Leger’s employees who accepted to contribute to the project. Six women and five men were recruited. We invited each of them to watch the four ads one after the other. We captured their facial expressions using a webcam during the viewing. Participants were alone in a room reserved for the project to avoid any external influence on their expressions. Adverts were presented in a different order for each participant.
After data collection, videos of all participants were edited to produce four videos (one for each ad) resulting in a total of 44 videos. We produced the analysis using the FaceReader software at the Tech3Lab of HEC Montreal. The emotional summary (% of each emotion) and the emotional valence were calculated for each ad (average for all participants). Therefore, results presented in this post are based on the analysis of those measures and the observation of trends across the data.
For more information on FaceReader, we suggest you to read the following post (in French): Facial Expressions as a Source of Information. To see how we used FaceReader in a political context, you can have a look at our post on the federal party leaders debate in French at Radio-Canada, Munk Debate or Face à Face TVA.
References:
- eMarketer (2015). “Primary Attitude Toward Social Media Ads According to US Social Media Users, by Site/App, Aug 2015”, graph.
- eMarketer (2015). “Reasons that Mobile Users Worldwide Are Less Likely to Skip Digital Video Ads and Pay More Attention to Them”, July 2015 », graph.
- eMarketer (2015). “Viewers in China Not Loving Digital Video Ads”, article.
- Harvard Business Review (2015). “Why Some Videos Go Viral”, Harvard Business Review, September 2015, p. 34-35.
- Pirouz, D. M., Johnson, A. R., Thomson, M. et R. Pirouz (2015). “Creating Online Videos That Engage Viewers”, MIT Sloan Management Review, vol. 56, p. 83-88.


